Performance Map
Performance Map - Firefox Add-on
Add-on stats
- tabs

- activeTab
- http://*/*
- https://*/*
Ranking
Other platforms
Add-on summary
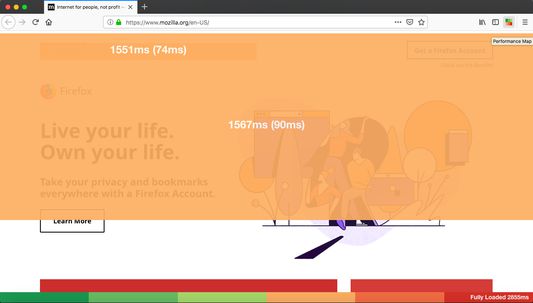
PerformanceMap: front-end performance heatmap
Add-on to create a front-end performance heatmap of resources loaded in the browser using the Resource Timing API.
Usage
Wait for a page to fully load and then click WebExtension icon to overlay a performance heatmap.
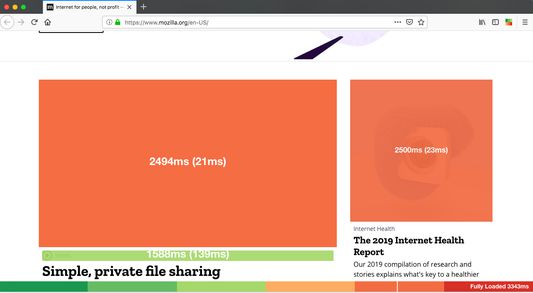
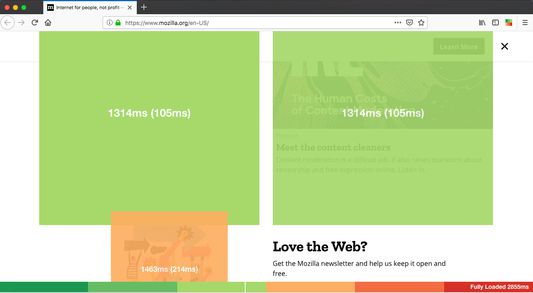
The heatmap colours and the first ms value indicate at what point in the page load the image finished loading. It's a good indicator of user experience... "It took 3450ms before the user saw this image." The second value in brackets is the time it took the browser to load that specific image.
The legend attached to the bottom of the page shows timings for the full page load and hovering over a coloured area on the heatmap will move the timeline indicator to show you when that image was fully loaded.
Credits
It is based on open source project - https://github.com/zeman/perfmap
Add-on safety
Risk impact
Performance Map requires some sensitive permissions that could impact your browser and data security. Exercise caution before installing.
Risk likelihood
Performance Map has earned a fairly good reputation and likely can be trusted.