TradingLever - Stock Analysis
Add-on stats
- activeTab
Ranking
Other platforms
Add-on summary
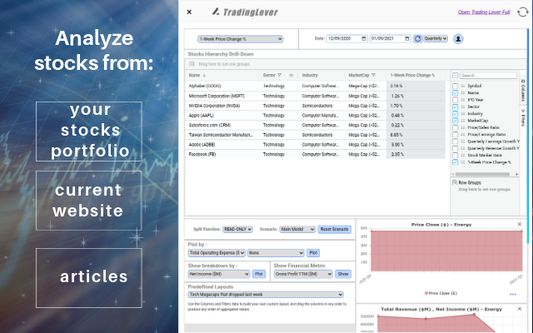
TradingLever connects to your current browser window to pull stock market symbols you’re viewing and provides a full dashboard for analysis and comparison between the companies in the list.
Use cases: Load stocks list from a news article you’re reading and analyze them. Load from a list of “trending” symbols and analyze them. Load list from your personal portfolio (e.g. from your trading website) and analyze/compare them. Load from any other custom list you’re tracking and analyze the companies in the list.
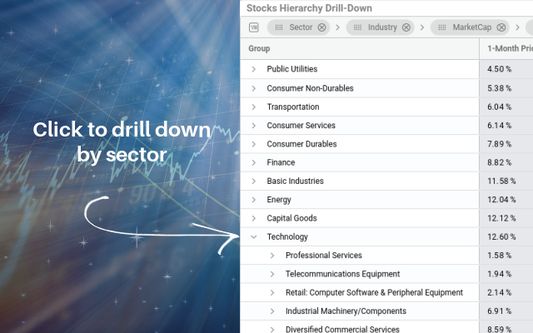
How it works: On loading the extension, the list on the left pane is filled with company symbols extracted from the current website. On the second column we see a financial metric - by default this is "1-Week Price Change %". It is possible to sort the list by this column by clicking on the column name, or change this column to any other property, using the listbox above. Properties include EPS, EBIT, price/revenue growth rates, financial ratios, and more. It is also possible to add more columns by clicking on the "Columns" Tab on the right, and either clicking the checkbox or dragging columns into the table.
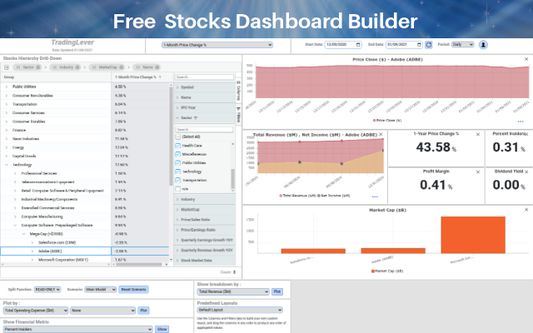
Stocks dashboard: On clicking a symbol/name in the left pane, the whole dashboard will be refreshed to show the income/profit, price chart, and financial metrics for the selected item. Also, a comparison of all list items by market cap will be shown in a barchart at the bottom.
Custom plots:
See moreAdd-on safety
Risk impact

TradingLever - Stock Analysis does not require any sensitive permissions.
Risk likelihood

TradingLever - Stock Analysis is probably trust-worthy. Prefer other publishers if available. Exercise caution when installing this add-on.


